
ETC Announces 2012 Third Quarter Results
- Net sales increased 6.9% to a quarterly record of $17.3 million
- Income before income taxes of $1.8 million
- Diluted Earnings per share of $0.01
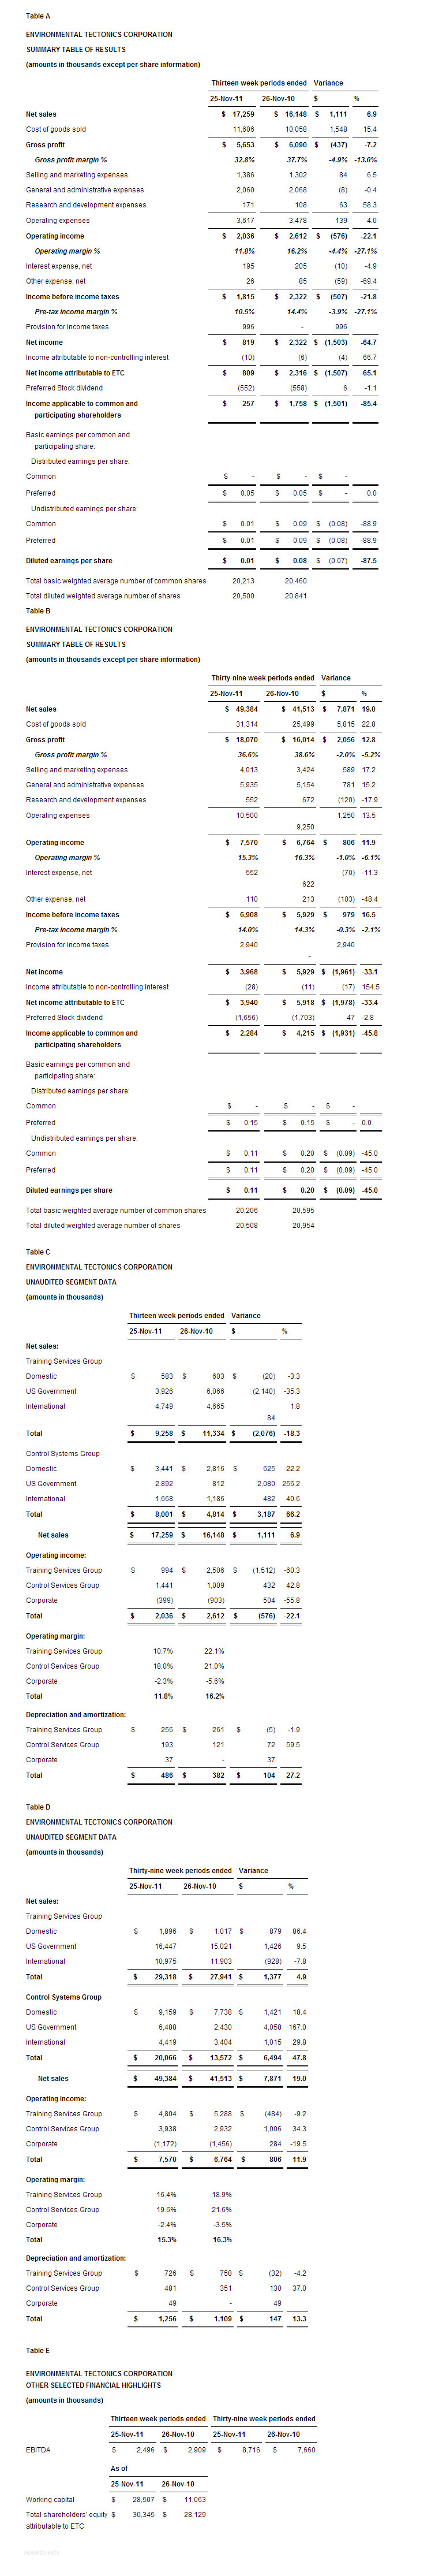
SOUTHAMPTON, PA, USA, January 10, 2012 – Environmental Tectonics Corporation (OTCQB: ETCC) (“ETC” or the “Company”) today reported net sales for the 2012 third fiscal quarter of $17.3 million, an increase of $1.1 million, or 6.9% over net sales of $16.2 million in the 2011 third fiscal quarter. Despite higher sales, income before income taxes declined to $1.8 million in the 2012 third quarter from $2.3 million in the 2011 third quarter, due primarily to increased manufacturing costs for a current project. Net income attributable to ETC in the 2012 third fiscal quarter was $809 thousand, or $0.01 per fully diluted share, a decrease of $1.5 million, or $0.08 per fully diluted share, from the 2011 third fiscal quarter; however, 2012 third quarter net income reflects a provision for income taxes of $1.0 million, whereas there was no such provision for income taxes in the prior year quarter.
William F. Mitchell, ETC’s President and Chairman, stated, “We are very pleased with increased sales to domestic commercial and international customers, and with record sterilizer bookings within the CSG Segment. In 2012, we are hopeful that we can continue our robust sales and increase our net income.”
Third Quarter Results of Operations:
Domestic sales in the 2012 third quarter were $4.0 million, an increase of $605 thousand, or 17.7%, over the 2011 third quarter sales of $3.4 million. The increase in Domestic sales is due primarily to an increase in Hyperbaric and Environmental product sales within the CSG segment. Domestic sales represented 23.3% of the Company’s total sales in the 2012 third quarter, and 21.2% of the Company’s total sales in the 2011 third quarter.
U.S. Government sales in the 2012 third quarter were $6.8 million, a decrease of $60 thousand, or 0.9%, compared to 2011 third quarter sales of $6.9 million, and represented 39.5% of total sales in the 2012 third quarter versus 42.6% for the 2011 third quarter. This slight decrease is the result of lower sales of Pilot Training Systems, offset in part, by an increase in sales of a suite of research altitude chambers.
International sales for the 2012 third quarter, including sales by our 95%-owned subsidiary in Poland, ETC-PZL Aerospace Industries SP. Z 0.0, (“ETC-PZL”), were $6.4 million as compared to $5.9 million in the 2011 third quarter, an increase of $566 thousand, or 9.7%, and represented 37.2% of total sales in the 2012 third quarter as compared to 36.2% in the 2011 third quarter. The International sales reflect an increase in Hyperbaric and Environmental product sales, as well as sales for ETC-PZL during the quarter, offset in part, by a decrease in Pilot Training System sales. International sales in the 2012 third quarter included $3.7 million in sales to the Korean government. International sales in the 2011 third quarter included $5.1 million in sales to the Korean government.
Segment sales
Sales of our Training Services Group (TSG) products were $9.3 million the 2012 third fiscal quarter, a decrease of $2.1 million, or 18.3% from 2011 third fiscal quarter. Sales of these products accounted for 53.6% of net sales versus 70.2% in the 2011 third fiscal quarter. Sales in our other segment, the Control Systems Group (CSG), increased $3.2 million, or 66.2%, and constituted 46.4% of our net sales compared to 29.8% in fiscal 2011.
Gross profit
Gross profit for the 2012 third quarter was $5.7 million as compared to $6.1 million in the 2011 third quarter, a decrease of $437 thousand, or 7.2%. The reduction in gross profit resulted primarily from costs related to a U.S. Government contract, which also caused a reduction in the gross profit margin as a percentage of sales for the 2012 third quarter to 32.8%, as compared to 37.7% for the same period a year ago.
Operating expenses
Selling and marketing expenses for the 2012 third quarter were $1.4 million as compared to $1.3 million in the 2011 third quarter, an increase of $84 thousand, or 6.5%. As a percentage of net sales, selling and marketing expenses decreased slightly to 8.0% in the 2012 third quarter from 8.1% in the 2011 third quarter. The dollar increase was primarily a result of the employment of additional sales people, offset in part, by reduced commissions due to a shift in the mix of sales towards non-commission generating sales.
General and administrative expenses for the 2012 third quarter of $2.1 million remained unchanged as compared to the 2011 third quarter. As a percentage of net sales, general and administrative expenses decreased to 11.9% in the 2012 third quarter from 12.8% in the 2011 third quarter. Although the dollar amount of general and administrative expense did not change, there was a reduction in legal expense, offset by increases in other expenses.
Research and development expenses, which are charged to operations as incurred, were $171 thousand in the 2012 third quarter as compared to $108 thousand in the 2011 third quarter. Most of the Company’s research efforts, which were and continue to be a significant cost of its business, are included in cost of sales for applied research pertaining to specific contracts, as well as research for product enhancement. The increase was a result of less research and development expenses included in the cost of sales in the 2012 third quarter as compared to the 2011 third quarter.
Operating income
Operating income decreased by $576 thousand, or 22.1%, to $2.0 million in the 2012 third quarter, which reflected a reduced gross profit, primarily from costs related to a U.S. Government contract, on higher sales volume, and higher operating expenses.
On a segment basis, the TSG had an operating income of $1.0 million in the 2012 third quarter, a $1.5 million decrease from the segment operating income of $2.5 million in the 2011 third quarter. The technical complexity of a certain product in one of the U.S. Government contracts within the TSG resulted in increased costs during the 2012 third quarter. The CSG had an operating income of $1.4 million in the 2012 third quarter, a $432 thousand improvement over the segment operating income of $1.0 million in the 2011 third quarter. These segment operating results were offset, in part, by unallocated corporate expenses of $399 thousand and $903 thousand in the 2012 and 2011 third fiscal quarters, respectively.
Interest, other expense, and taxes
Interest expense, net, for the 2012 third quarter was $195 thousand as compared to $205 thousand for the 2011 third quarter, representing a reduced debt at ETC-PZL partially offset by a higher level of bank borrowing as a result of cash used in operations, primarily for costs and estimated earnings in excess of billings on uncompleted long-term contracts. Other expense, net, for the 2012 third quarter was $26 thousand as compared to $85 thousand for the 2011 third quarter. The decrease consists primarily of lower foreign currency exchange losses.
As of November 25, 2011, the Company reviewed the components of its deferred tax assets and determined, based upon all available information, that its current and expected future operating income will more likely than not result in the realization of its deferred tax assets relating primarily to its net operating loss carryforwards. The Company has a net deferred tax asset related to its net operating loss carryforwards of $7.6 million. Income tax provisions of $1.0 million were recorded in the 2012 third quarter. This follows a $7.7 million benefit recorded in the 2011 fourth quarter, which significantly reduced the valuation allowance against the Company’s deferred tax asset. Due to the utilization of net operating loss carry forwards available, and valuation allowances on the deferred tax asset in the 2011 first three quarters, the Company did not record an income tax provision on income in the 2011 first three quarters.
As of November 25, 2011, the Company had approximately $23.6 million of federal net loss carry forwards available to offset future income tax liabilities, beginning to expire in 2025. In addition, the Company has the ability to offset deferred tax assets against deferred tax liabilities created for such items as depreciation and amortization.
Net income
Net income attributable to ETC was $809 thousand, or $0.01 diluted earnings per share, in the 2012 third quarter, compared to $2.3 million or $0.08 diluted earnings per share, during the 2011 third quarter, representing a decrease of $1.5 million, or 65.1%. The decline in net income reflects a reduction in income before income taxes of $507 thousand, a result of lower gross profits, primarily from costs related to a U.S. Government contract, on higher sales in the 2012 third quarter, and more significantly, a provision for income taxes of $1.0 million. There was no provision for income taxes in the 2011 third quarter.
First Three Quarters Results of Operations:
Domestic sales for the 2012 first three quarters were $11.1 million as compared to $8.8 million for the 2011 first three quarters, an increase of $2.3 million or 26.3%. This increase is due primarily to an increase in Simulation and Sterilizer product sales, as well as Pilot Training Systems and Services. Domestic sales represented 22.4% of the Company’s total sales for the 2012 first three quarters as compared to 21.1% of the Company’s total sales for the 2011 first three quarters.
U.S. Government sales for the 2012 first three quarters were $22.9 million as compared to $17.4 million for the 2011 first three quarters, an increase of $5.5 million or 31.4%. This increase is largely the result of sales of the Company’s Pilot Training Systems products under significant contracts from the U.S. Air Force to provide a high performance human centrifuge and a suite of research altitude chambers, and from the U.S. Navy for a research disorientation device. U.S. Government sales represented 46.4% of the Company’s total sales for the 2012 first three quarters as compared to 42.0% of the Company’s total sales for the 2011 first three quarters.
International sales for the 2012 first three quarters, including sales by ETC-PZL, the Company’s Poland subsidiary, were $15.4 million as compared to $15.3 million for the 2011 first three quarters, an increase of $87 thousand or 0.6%. The slight increase in International sales primarily reflects an increase in sales of Hyperbaric products, offset in part, by a decrease in sales of Pilot Training System and Environmental products. International sales represented 31.2% of the Company’s total sales for the 2012 first three quarters as compared to 36.9% of the Company’s total sales for the 2011 first three quarters. International sales for the 2012 first three quarters included $7.6 million in sales to the Korean government. International sales for the 2011 first three quarters included $12.9 million in sales to the Korean government.
Segment sales
Sales of our Training Services Group (TSG) products were $29.3 million the 2012 fiscal first three quarters, an increase of $1.4 million, or 4.9% over 2011 fiscal first three quarters. Sales of these products accounted for 59.4% of net sales versus 67.3% in the 2011 fiscal first three quarters. Sales in the Control Systems Group (CSG), increased $6.5 million, or 47.8%, and constituted 40.6% of our net sales compared to 32.7% in 2011 fiscal first three quarters.
Gross profit
Gross profit for the 2012 first three quarters was $18.1 million as compared to $16.0 million for the 2011 first three quarters, an increase of $2.1 million or 12.8%. The increase in gross profit dollars was a result of an increase in both U.S. Government and Domestic sales. The effect of higher sales was partially offset by lower gross profit margin on those sales compared to the same period in the prior year. Gross profit margin as a percentage of sales for the 2012 first three quarters was 36.6% compared to 38.6% for the same period a year ago. The 2.0 percentage point reduction in the gross profit margin primarily reflects costs related to a U.S. Government contract.
Operating expenses
Selling and marketing expenses for the 2012 first three quarters were $4.0 million as compared to $3.4 million for the 2011 first three quarters, an increase of $589 thousand, or 17.2%. As a percentage of net sales, selling and marketing expenses decreased slightly to 8.1% for the 2012 first three quarters from 8.2% for the 2011 first three quarters. The dollar increase was primarily a result of the employment of additional sales people, offset in part, by reduced commissions due to a higher percentage of the product mix in the 2012 first three quarters being from sales to the U.S. Government.
General and administrative expenses for the 2012 first three quarters were $5.9 million as compared to $5.2 million for the 2011 first three quarters, an increase of $781 thousand or 15.2%. As a percentage of net sales, general and administrative expenses decreased to 12.0% for the 2012 first three quarters from 12.4% for the 2011 first three quarters. The dollar increase is primarily a result of increases in salaries, European operations, audit, and consulting expenses.
Research and development expenses, which are charged to operations as incurred, were $552 thousand for the 2012 first three quarters as compared to $672 thousand for the 2011 first three quarters. Most of the Company’s research efforts, which have been and continue to be a significant cost of its business, are included in cost of sales for applied research pertaining to specific contracts, as well as research for product enhancement. The decrease was a result of more research and development expenses included in the cost of sales for the 2012 first three quarters as compared to the 2011 first three quarters.
Operating income
Operating income increased by $806 thousand, or 11.9%, to $7.6 million for the 2012 first three quarters, which reflects the effect of higher sales volume and gross profit, offset by the lower gross profit margin on those sales, and increased operating expenses.
On a segment basis, the TSG had an operating income of $4.8 million for the 2012 first three quarters, a $484 thousand decrease compared to the segment operating income of $5.3 million for the 2011 first three quarters. The technical complexity of a certain product in one of the U.S. Government contracts within the TSG resulted in increased costs during the 2012 first three quarters. The CSG had operating income of $3.9 million for the 2012 first three quarters, a $1.0 million improvement over the segment operating income of $2.9 million for the 2011 first three quarters. These segment operating results were offset, in part, by unallocated corporate expenses of $1.1 million and $1.4 million for the 2012 and 2011 first three quarters, respectively.
Interest, other expense, and taxes
Interest expense, net, for the 2012 first three quarters was $552 thousand as compared to $622 thousand for the 2011 first three quarters, representing a decrease of $70 thousand, or 11.3%, reflecting reduced bank borrowing, particularly during the first quarter, and lower borrowing at ETC-PZL.
Other expense, net, for the 2012 first three quarters was $110 thousand as compared to $213 thousand for the 2011 first three quarters. These expenses consist primarily of bank and letter of credit fees, as well as foreign currency exchange gains or losses, and the decrease is primarily a result of a letter of credit refund.
As of November 25, 2011, the Company reviewed the components of it deferred tax assets and determined, based upon all available information, that its current and expected future operating income will more likely than not result in the realization of its deferred tax assets relating primarily to its net operating loss carryforwards. The Company has a net deferred tax asset related to its net operating loss carryforwards of $7.6 million. Income tax provisions of $2.9 million were recorded over the 2012 first three quarters. This follows a $7.7 million benefit recorded in the 2011 fourth fiscal quarter, which significantly reduced the valuation allowance against the Company’s deferred tax asset. Due to the utilization of net operating loss carry forwards available, and valuation allowances on the deferred tax asset in the 2011 first three quarters, the Company did not record an income tax provision on income in the 2011 first three quarters.
As of November 25, 2011, the Company had approximately $23.6 million of federal net loss carry forwards available to offset future income tax liabilities, beginning to expire in 2025. In addition, the Company has the ability to offset deferred tax assets against deferred tax liabilities created for such items as depreciation and amortization.
Net income
Net income attributable to ETC was $3.9 million, or $0.11 diluted earnings per share, in the 2012 first three quarters as compared to $5.9 million or $0.20 diluted earnings per share, during the 2011 first three quarters, representing a decrease of $2.0 million, or 33.4%. The decline in net income includes an increase in income before income taxes of $1.0 million, which was primarily a result of increased gross profit on higher sales in the 2012 first three quarters, partially offset by an increase in operating expenses of $1.3 million, and more significantly, a provision for income taxes of $2.9 million. There was no such provision for income taxes recorded over the 2011 first three quarters.
Liquidity and Capital Resources
During the first three quarters of fiscal 2012, the Company operated at an elevated level of production to satisfy the requirements of long-term contracts in the Company’s backlog of $105.5 million that existed at February 25, 2011, which resulted in the Company borrowing under its line of credit to fund operating activities during the 2012 first three quarters. The Company’s availability at November 25, 2011 was $2.1 million under its line of credit with PNC Bank; the Company’s availability at January 4, 2012 was $3.3 million. The Company expects the availability to continue increasing as several of our long-term contracts with back loaded cash receipts begin to wind down. Working capital, or current assets less current liabilities, was $28.5 million at November 25, 2011 compared with $11.1 million at February 25, 2011. The Company’s current ratio, current assets divided by current liabilities, improved to 2.4:1 at November 25, 2011 from 1.6:1 at February 25, 2011.
Financial Tables Follow
Forward-looking Statements
This news release contains forward-looking statements, which are based on management's expectations and are subject to uncertainties and changes in circumstances. Words and expressions reflecting something other than historical fact are intended to identify forward-looking statements, and these statements may include terminology such as "may", "will", "should", "expect", "plan", "anticipate", "believe", "estimate", "future", "predict", "potential", "intend", or "continue", and similar expressions. We base our forward-looking statements on our current expectations and projections about future events or future financial performance. Our forward-looking statements are subject to known and unknown risks, uncertainties and assumptions about ETC and its subsidiaries that may cause actual results to be materially different from any future results implied by these forward-looking statements. We caution you not to place undue reliance on these forward-looking statements.